


CenterPoint disputes KPRC 2’s investigation into power outage hot spots
After persistent requests for detailed information about power outage hot spots in the Houston area, CenterPoint Energy finally provided answers following the airing of KPRC 2 Investigates’ report.
After persistent requests for detailed information about power outage hotspots in the Houston area, CenterPoint Energy finally provided answers following the airing of KPRC 2 Investigates’ report.
KPRC 2’s investigation revealed Houston residents experienced the highest frequency of power outages among major U.S. cities in August 2025. Despite avoiding severe hurricane season weather, some neighborhoods endured up to 18 times more outages than the national average.
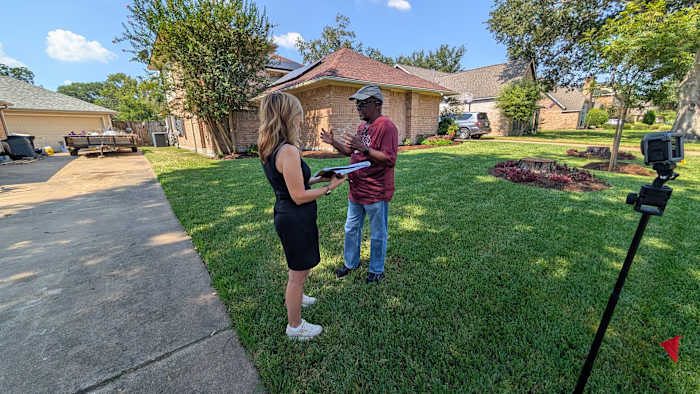
KPRC 2’s data analysis revealed several outage hotspots in the Greater Houston area. (Check your zip code here.) KPRC 2 Investigator Amy Davis and photojournalist Adrian Montes went into these neighborhoods to talk with people dealing with issues.
August power outage findings include:
- Pecan Grove and Harvest Green subdivisions (parts of 77406) = 7.3 outages
- North Harris County near Walters and Spears Road (parts of 77014) = 7 outages
- JFK and Aldine Bender area (parts of 77032) = 6.3 outages
- Chambers County’s Eagle Heights subdivision (parts of 77523) = 6.12 outages
- Klein area’s Cutten Green neighborhood (parts of 77066) = 6 outages
“It seems like there’s a problem that everybody knows about—but nobody can explain why,” said Tyler Steer, a Fort Bend County resident in Pecan Grove.
While many outages were momentary, energy experts say the frequency is abnormal. Bob Marshall, CEO of Whisker Labs, the company providing outage data through sensors installed in homes and businesses nationwide, noted, “Even short power outages are disruptive.”
CenterPoint Energy issued an initial statement but didn’t answer specific questions about why people in the highlighted areas are dealing with outages. After our story aired, they responded by email with more answers.
CenterPoint Energy disputes KPRC 2 data analysis
“CenterPoint’s outage data is measured across our approximately three million customers in the Greater Houston region, and according to your reporting, Whisker Labs relies on approximately 18,000 devices in the Houston region. We are confident that our data is an accurate and comprehensive representation of our system performance.”
The statement goes on to explain how outages are tracked by equipment owned and operated by CenterPoint based on events on “our side of the meter.”
“Whiskers Labs, looks at what happens ‘behind the meter,’ or inside the customer’s home or business, such as blowing a fuse, aging wiring or even smart devices that can register brief voltage changes as outages. This difference is critical because our data reflects the actual performance of the grid we manage, while Whisker’s data can include factors outside our control,” the statement said.
CenterPoint also gave details from each zip code we outlined in our original report. They found one area that had more outages than we reported.
“We’ve reviewed the August data you referenced from Whisker Labs and compared it to CenterPoint’s data. Per your request, we averaged sustained (more than one minute) and momentary (less than one minute) interruptions of electrical service for the ZIP codes you highlighted.”
CenterPoint sent this comparison:
| ZIP Code | CenterPoint Energy (Aug 2025) | Whisker (Aug 2025) |
|---|---|---|
| 77014 | 1.34 | 7.00 |
| 77032 | 0.70 | 6.33 |
| 77066 | 7.17 | 6.00 |
| 77406 | 2.37 | 7.30 |
| 77523 | 2.16 | 6.12 |
“The only exception is 77066, where our number (7.17) is higher than Whisker’s (6.00).”
CenterPoint says those outages were caused by weather disruptions and vegetation. In that case, crews responded by trimming vegetation and resetting the equipment.
State Senator Lois Kolkhorst, representing the Fort Bend area, expressed concern about the outage findings. “There’s something major wrong in that area. And I, for one, as their lawmaker, am going to be looking into this and demanding answers,” she said.
Residents experiencing frequent outages are encouraged to:
- Contact their state representatives
- File complaints with the Public Utility Commission (PUC)
MORE INFO: Check your zip code outage data here.
KPRC 2’s Amy Davis and the team are still working to find answers for you about power outage issues impacting your daily lives. Email the team if you need help: ADavis@kprc.com and producer Andrea Slaydon at ASlaydon@kprc.com.
CenterPoint Energy Statement
We understand how important reliable service is for customers, and we take outages seriously. We know that any disruption in service can be frustrating for customers – that’s why we’re working so hard to strengthen the reliability and resiliency of the grid through our Greater Houston Resiliency Initiative.
According to our reliability data on sustained outages, which is publicly filed annually in compliance with the Public Utility Commission of Texas, CenterPoint Energy had an average of 0.2 systemwide sustained (sustained = longer than a minute) outages per customer in August. This is half the national average reported by Whisker Labs of 0.4 outages per customer.
CenterPoint’s outage data is measured across our approximately three million customers in the Greater Houston region, and according to your reporting, Whisker Labs relies on approximately 18,000 devices in the Houston region. We are confident that our data is an accurate and comprehensive representation of our system performance.
CenterPoint’s outage data measures events on “our side of the meter” — meaning the electric delivery equipment that’s owned and operated by CenterPoint as the transmission and distribution utility. Whiskers Labs, looks at what happens “behind the meter,” or inside the customer’s home or business, such as blowing a fuse, aging wiring or even smart devices that can register brief voltage changes as outages. This difference is critical because our data reflects the actual performance of the grid we manage, while Whisker’s data can include factors outside our control.
We’ve reviewed the August data you referenced from Whisker Labs and compared it to CenterPoint’s data. Per your request, we averaged sustained (more than one minute) and momentary (less than one minute) interruptions of electrical service for the ZIP codes you highlighted. In most of these areas, our data is significantly lower than Whiskers Labs:
| ZIP Code | CenterPoint Energy (Aug 2025) | Whisker (Aug 2025) |
|---|---|---|
| 77014 | 1.34 | 7.00 |
| 77032 | 0.70 | 6.33 |
| 77066 | 7.17 | 6.00 |
| 77406 | 2.37 | 7.30 |
| 77523 | 2.16 | 6.12 |
The only exception is 77066, where our number (7.17) is higher than Whisker’s (6.00). The address you provided as reference for 77066 is on Circuit BA43. Here is a summary of service interruption activity for this circuit in August:
- Circuit BA43:
- Strong winds and lightning triggered automatic protective devices, resulting in multiple momentary disruptions on August 4.
- Lightning and vegetation caused several momentary disruptions and one extended outage (2 hours and 30 minutes) on August 18. Crews responded by trimming vegetation and resetting equipment.
- Multiple momentary disruptions tied to weather, which were automatically resolved by automatic protective devices.
You highlighted ZIP code 77406 in your Tuesday morning report. 77406 is made up of multiple circuits, and for example, the two circuits below experienced an elevated number of outages in August. Disruptions in those two circuits were driven by a combination of factors rather than a single cause. Key events for these two circuits included:
- Circuit OB46:
- A tree outside of CenterPoint’s easement fell on a primary line on August 10, impacting thousands of customers (approx. 45 minutes).
- Several planned inspections required temporary disruptions for safety (approx. 2 hours).
- Tree removal from electrical facilities on August 4 (approx. 2 hours).
- Customer-owned equipment needing repairs before reconnection, including an illegal bypass to a transformer.
- Burnt equipment on a pole required replacement on August 20.
- Multiple momentary disruptions tied to weather.
- Circuit OB49:
- A vehicle collision with a pole caused a large outage on August 8 (approx. 4 hours).
- Planned repair work on a pole on August 18 (approx. 5 hours).
- Broken insulator restoration on August 22 (approx. 9 hours).
- Padmount transformer damaged by a collision on August 13 (approx. 4 hours).
- Tree-related outages and equipment repairs, plus momentary disruptions during lightning and storm activity from August 19 – 21.
The above information speaks to the complexity of the electric system. Each ZIP code is served by hundreds of individual circuits, so an issue affecting one circuit does not necessarily represent the entire ZIP code. Outages often result from a mix of factors: severe weather, vegetation interference, planned work for reliability improvements, equipment failures, third-party damage, and even issues with customer-owned equipment.